

Welcome to The Cybersecurity Pulse (TCP)! I’m Darwin Salazar, Head of Growth at Monad and former detection engineer at Datadog. Each week, I bring you the latest security innovation and industry news. Subscribe to receive weekly updates! 📧
Hello from the middle of a very busy week 👋
On the personal front, Hacker Summer Camp is coming up fast, and between preparing for Vegas and moving homes this Friday, I’m buried. I’m giving the regular TCP news roundup a rest today, but I’ll be back Friday AM with something waaaay more special. Back to regular programming next week.
Before jumping into today’s post, next Tuesday I’m joining Mitchem Boles, Field CISO at Intezer for a webinar on fixing detection gaps at the source. We’ll get into ETL, detection engineering, and what AI SOC platforms need from the data layer beneath them.
Now, onto the logs 🪵
For the past few months, I’ve been focused on AI tooling security visibility. Think Claude Code, Codex, Cursor etc. What activity details each log source emits, what you can detect, key threat hunting and investigation signals and what their quirks and limitations are.
I started digging after finding surprisingly little useful coverage in SIEM rule packs and public detection repos like Sigma. In recent years, AI tooling has increasingly gained access to source code, terminals, repositories, internal documents, email, calendars, and outside systems through MCP. But somehow detection coverage isn’t keeping up. The rule repos and SIEM content I relied on in the past as a detection engineer simply hasn’t kept up with the times. Folks are either gatekeeping, there are new rule repos or the majority of the industry hasn’t kept up. I’d imagine it’s a mix of all 3.
Sure, many mature security teams (think Walmart, Robinhood, JPMC, NVIDIA, Netflix, AI labs) have been on top of this all along. However, many others are flying blind or trusting their AI security tools to catch everything.
Tools can help, but you still must understand the raw logs. If you don’t know what the source gives you, you don’t know what’s missing. You also can’t copy and paste the same rules into every company or deploy every OOTB rule your tools give you. That’s leads to a shit ton of false positives and noise. Most detections depend on what normal behavior looks like inside your environment.
That work has turned into five in-depth posts, each focused on a different AI log source. Below, I’m pulling out a few of the most useful findings from each. If you want to see what the logs look like, which fields matter, what to alert on, and where each source falls short, read the full post linked at the end of each section.
Here’s what we’ve covered so far.
Claude Code
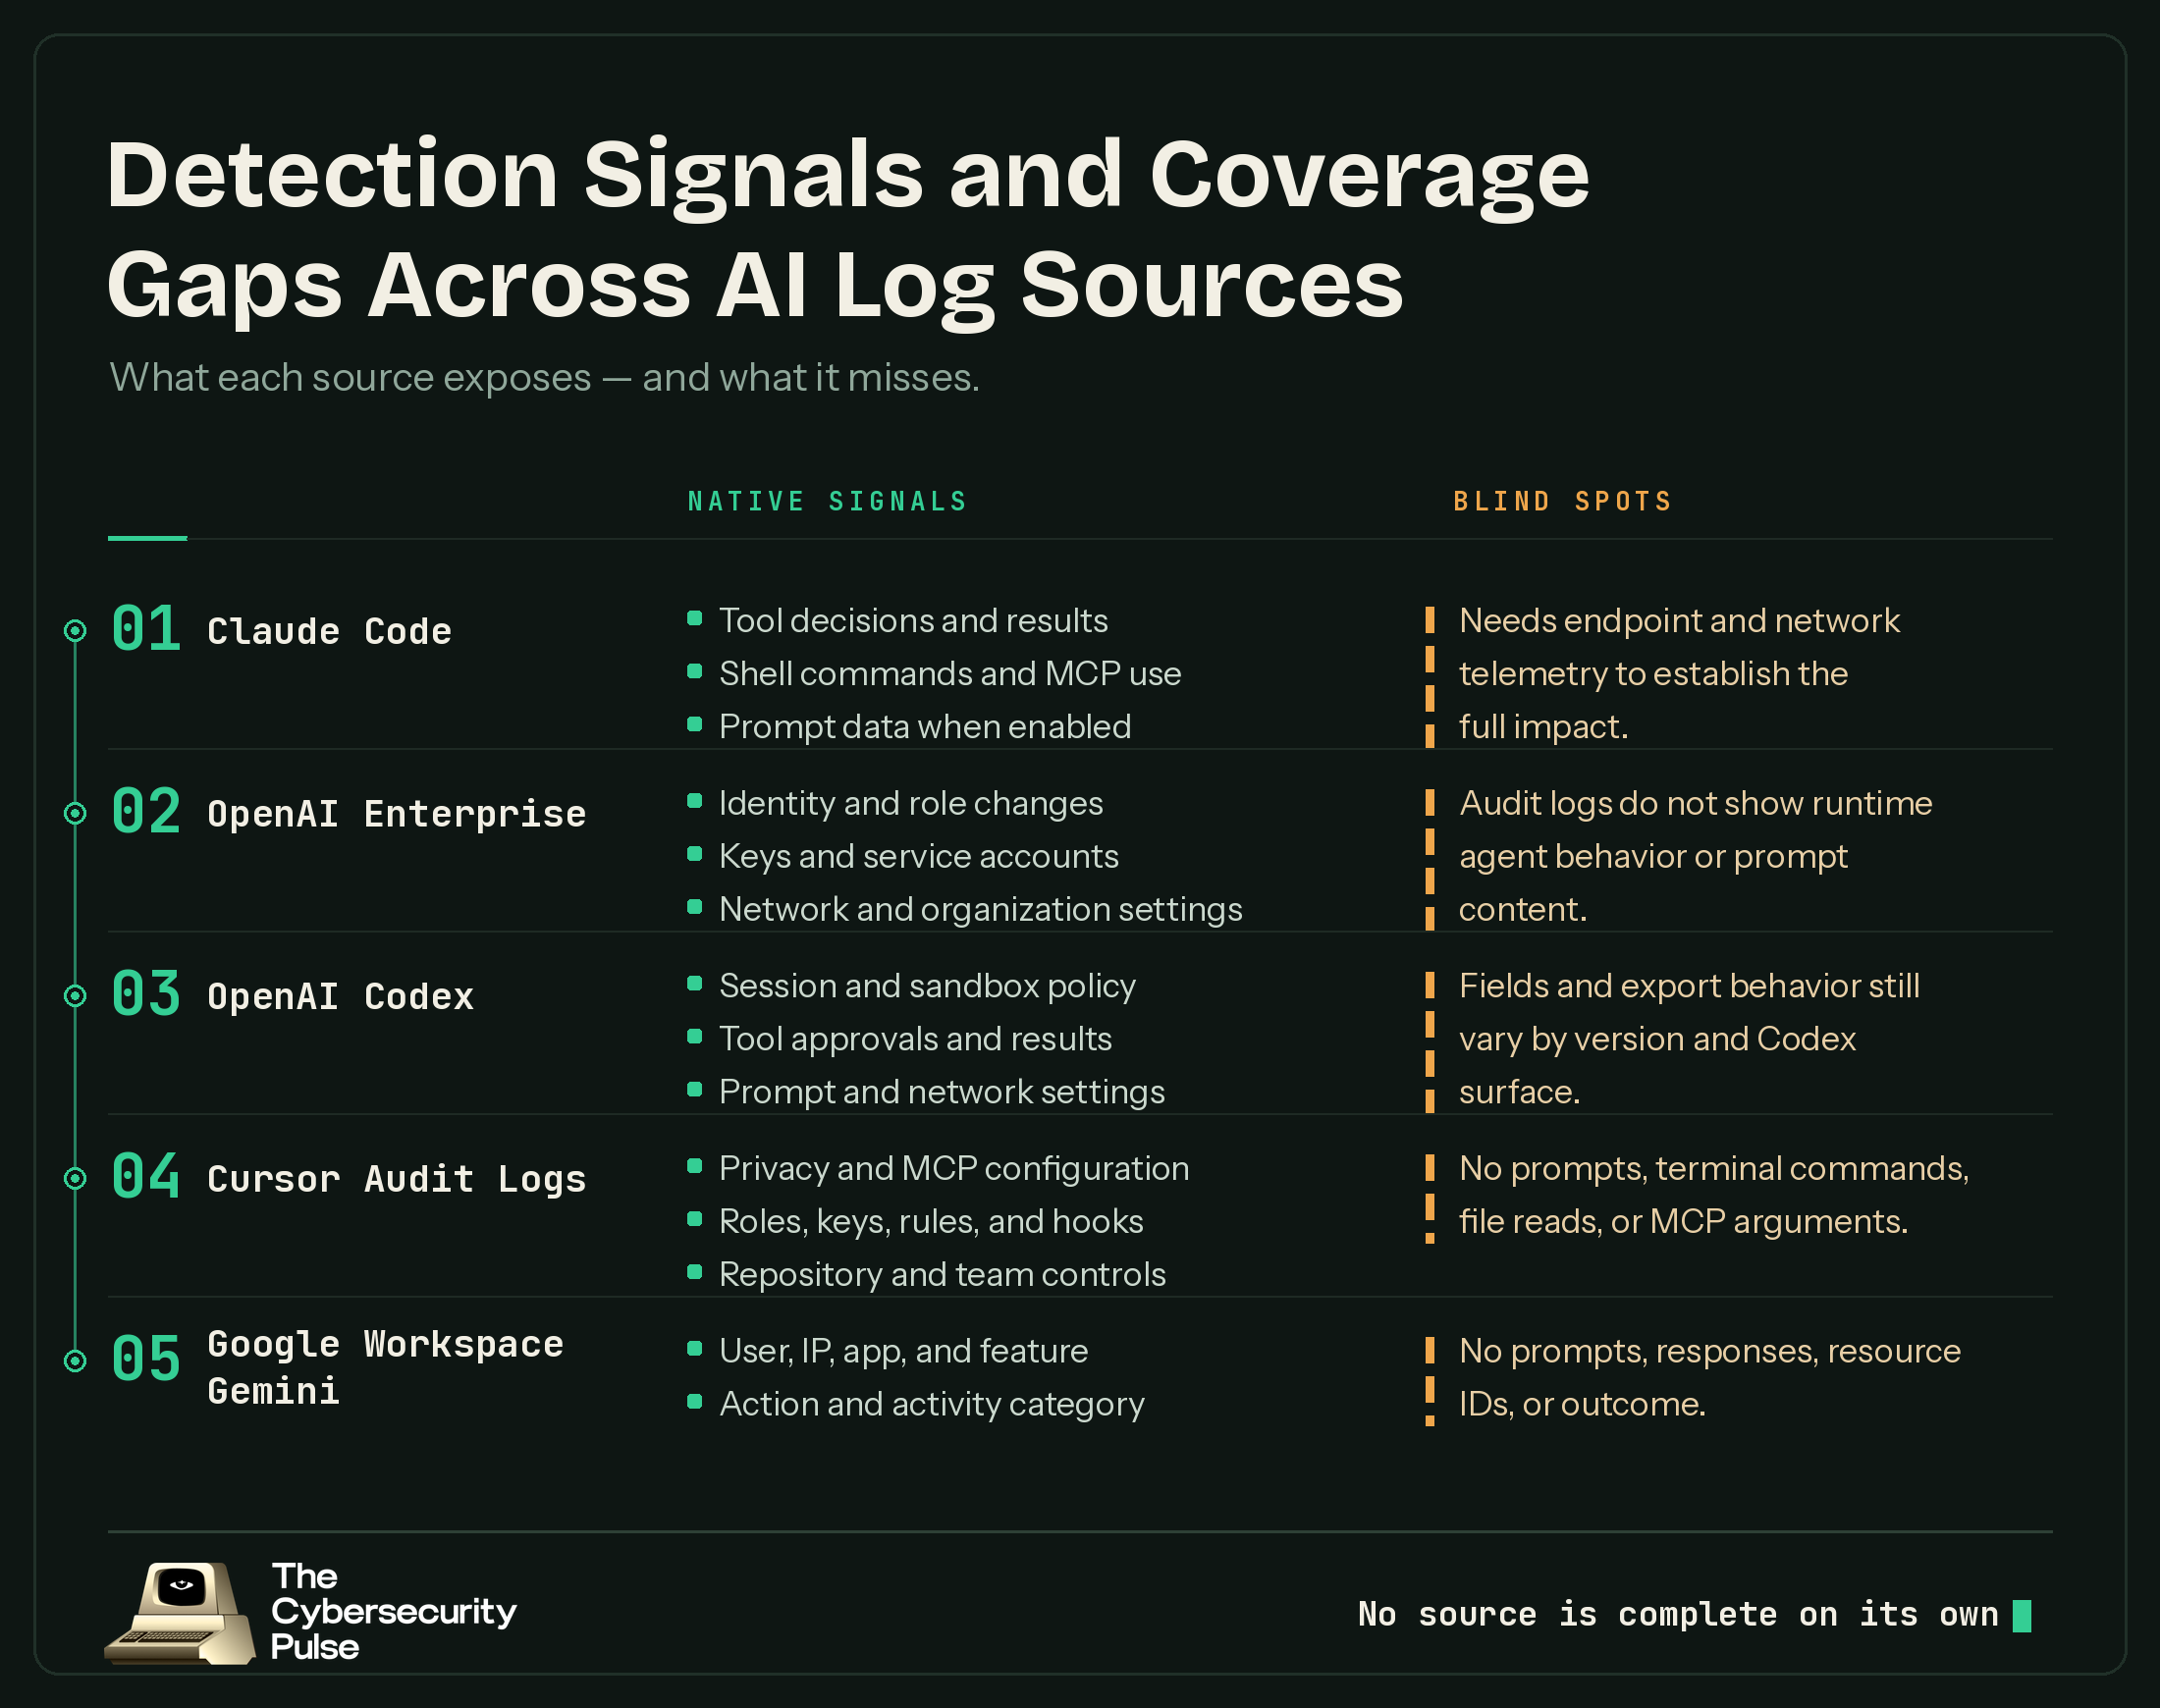
Claude Code can send OpenTelemetry metrics and logs for API calls, tool approvals, tool results, MCP usage, and prompts when prompt logging is turned on.
That gives defenders useful places to start. You can look for rejected shell commands, reads of .env files or cloud credentials, file access followed by curl or wget, and unknown MCP servers calling tools.
The problem is the format. Raw OTel arrives as deeply nested arrays of keys and values. Before analysts can use it, the data needs to be split into individual events and flattened into fields that are easy to search.
Read the full Claude Code post here.
Cursor Audit Logs
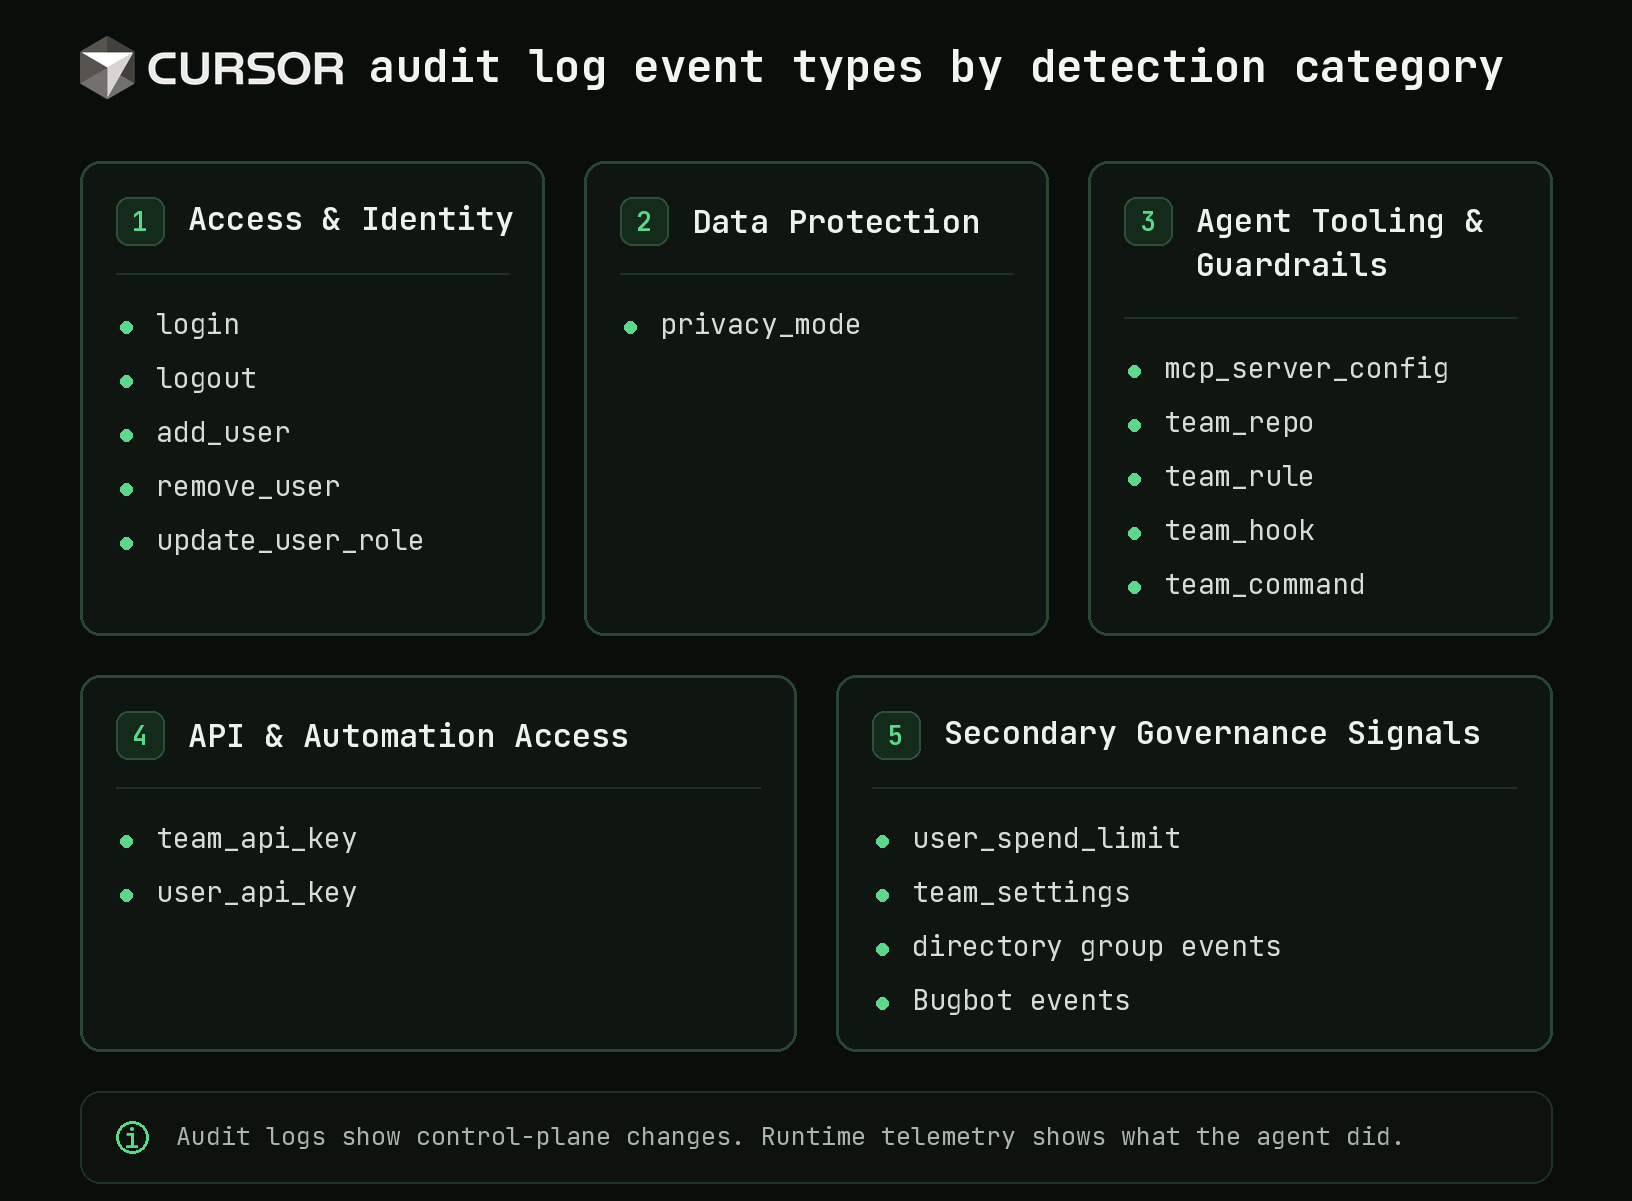
Cursor audit logs show changes to the settings around the agent. They do not show everything the agent did.
You can detect when Privacy Mode changes, a new MCP server is added, someone becomes an admin, an API key is created, or repository rules and hooks are weakened.
You will not see prompt text, terminal commands, file reads, or MCP arguments in the audit log. To investigate what the agent actually did, you still need endpoint, network, Git, CI/CD, and Cursor Hook data.
Read the full Cursor post here.
OpenAI Enterprise Audit Logs
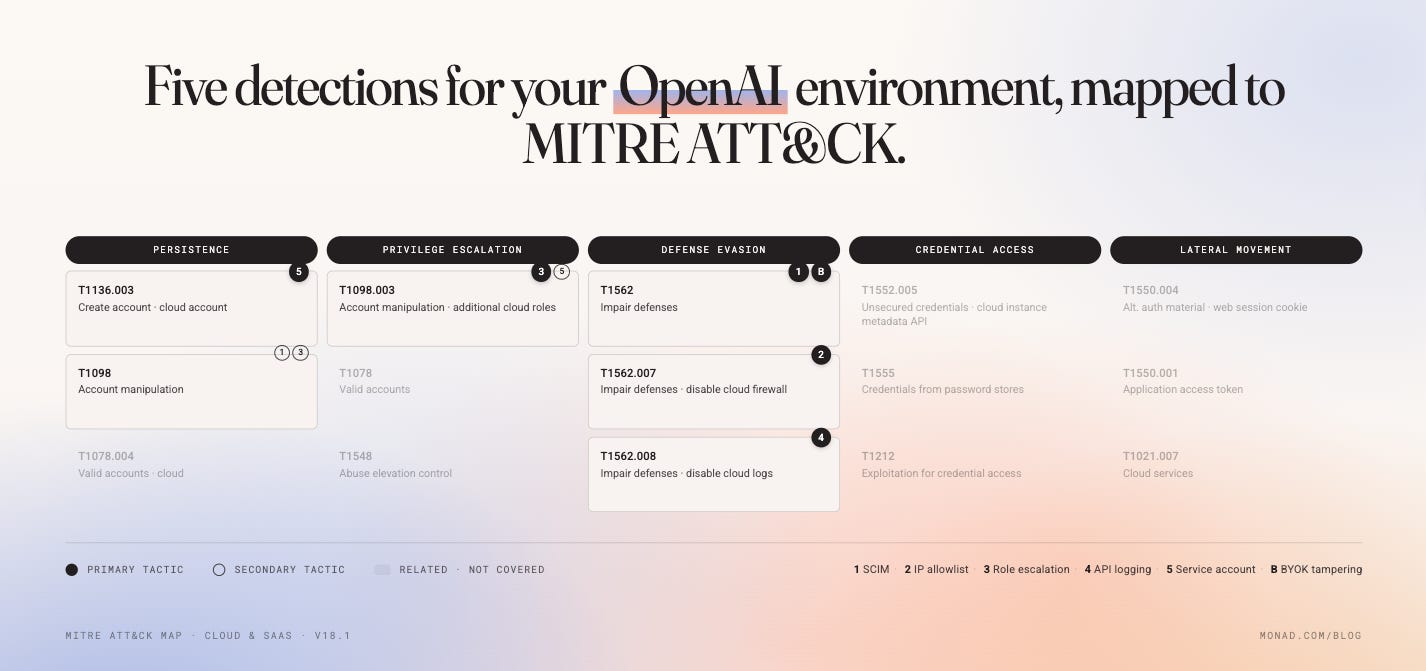
OpenAI Enterprise exposes 51 audit event types covering users, roles, API keys, service accounts, network controls, projects, and organization settings.
The first rules I’d ship are straightforward: alert when SCIM is disabled, an IP allowlist is removed or opened too widely, new permissions are added, API call logging is reduced, or an owner-level service account is created.
These events are useful on their own. They get much stronger when you add context from your identity provider, HR system, asset inventory, and change tickets. An admin change from the platform team during business hours is different from the same change made by a terminated employee.
Read the full OpenAI Enterprise post here.
OpenAI Codex OTel Logs
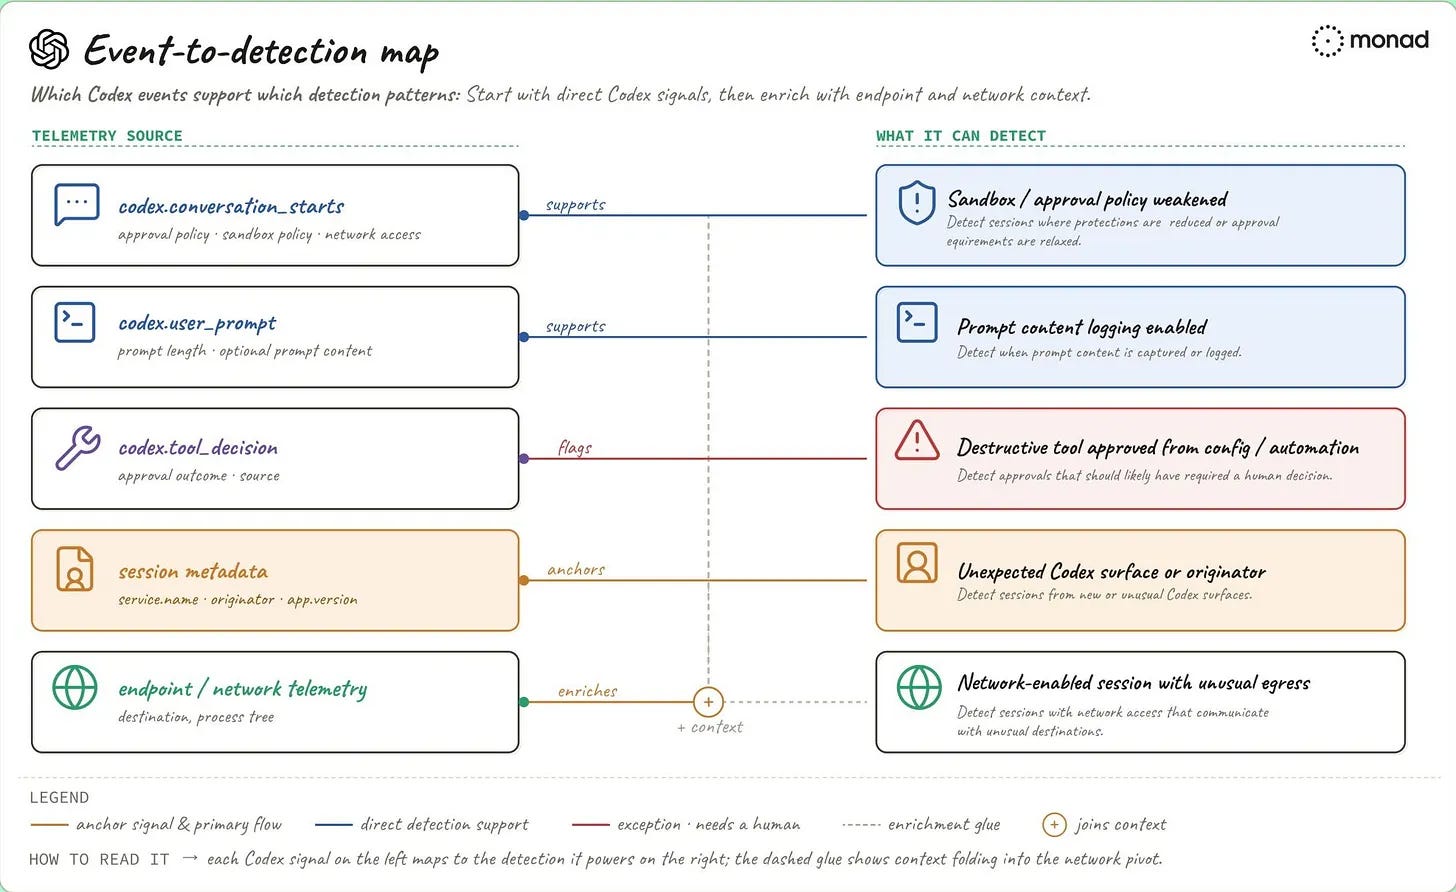
Codex OTel can show how a session started, which sandbox and approval settings were used, whether prompts were redacted, how tool calls were approved, what tools ran, and whether network access was allowed.
Useful checks include sessions running with full access and no approval, prompts leaving the machine without redaction, destructive tools approved by configuration instead of a person, unusual network traffic during an enabled session, and Codex suddenly appearing on a new laptop or CI runner.
Read the full OpenAI Codex post here.
Google Workspace Gemini
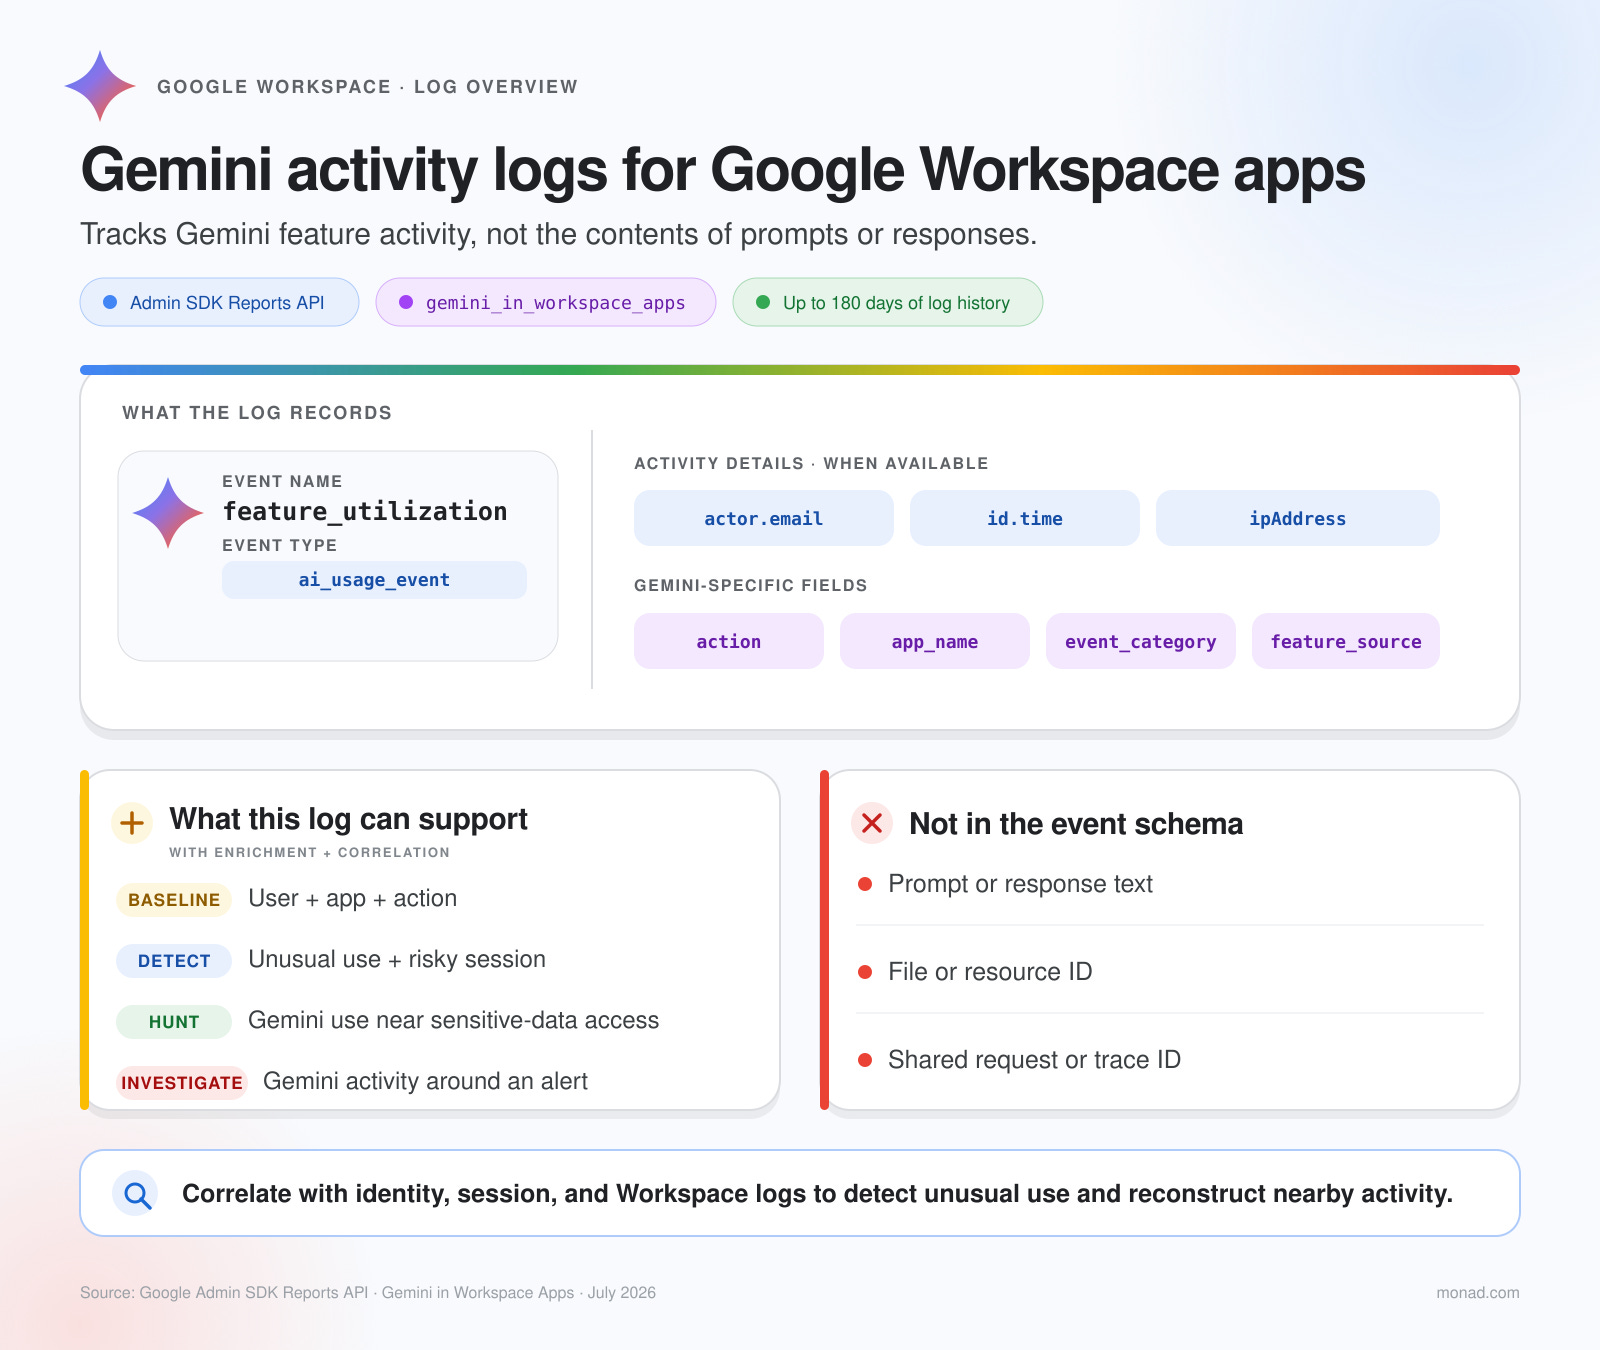
Gemini activity logs show who used Gemini, when they used it, their IP address, which Workspace app they were in, and which feature they used.
They do not show the prompt, response, file, email, calendar event, or other content involved. The log proves that Gemini was used. It does not prove what Gemini accessed or what happened next.
app_name tells you where to look next. Gemini activity in Drive should send you to Drive logs. Activity in Gmail should send you to Gmail logs. From there, you can match events from the same user within a tight time window and add Login, DLP, endpoint, and identity data.
Read the full Google Workspace Gemini post here.
The underlying thread across all 5 sources we’ve covered so far is that none of them offer complete visibility. Some cover control-plane activity very well, others cover data-plane activity well while some cover none super well. You need to know those limits before trusting any alert built on top of it which is why taking matters into your own hands is key.
Getting this right requires a lot of wrangling. Teams first have to collect the logs, clean up the fields, add the missing context, filter out low-value events, and route the useful data to their SIEM or data lake. Detection engineers can then use that prepared data to hunt and build rules around what’s abnormal in their environment.
Monad handles the data pipeline work that comes before detection. We have integrations for every source above and help teams collect, normalize, enrich, filter, and route the data. Detection and alerting still happen in the team’s SIEM, data lake, or analytics platform. If you’re working through any of these sources, we can help.
More to come on this series so follow along!
If you’ll be in Vegas, hit me up! Schedule a meet with Monad or sign up for one of our Black Hat events, including The Morning Burn, our SecOps Sunset Social 550 feet above Vegas, and The Wurst Security Party.
Interested in sponsoring TCP?
Sponsoring TCP not only helps me continue to bring you the latest in security innovation, but it also connects you to a dedicated audience of 20,000+ CISOs, practitioners, founders, and investors across 135+ countries 🌎